
Personally, I really enjoy the weeks when the ideas force us to explore our genealogy software. I've looked at the timeline chart function in my software program (Reunion) before, but never spent any time figuring out how to really do anything with it. So, I decided to explore my software's timeline functionality and make a five generation timeline chart.
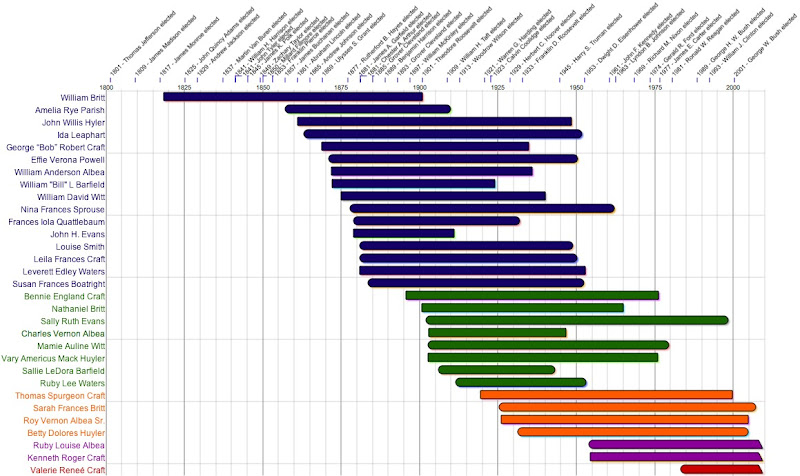
It's an easy process. First, mark everyone that you want to show up in your chart. This just means that you click a little box on each person's page. Next, go to "Create" on the file menu and select "Timeline Chart." Everyone is automatically sorted by birth, but you can sort by death, age, etc. I very easily changed the colors of each person to match others in their generation. Next, I added "Perspective Events" that I had previously loaded into the software (see how to do that here). In this case, I chose US Presidents. I expanded the chart a bit and moved some of the presidents over a tad to make them all fit. To save this chart, simply "Save As," just as with most any other document.
I ended up with a chart that very nicely shows five generations of my family. You can see that the first person, William Britt, was considerably older than others of that generation. Otherwise everyone else just sorta flows, with small gaps to indicate generational changes.
No comments:
Post a Comment